1
2
3
4
5
6
7
8
9
10
11
12
13
14
15
16
17
18
19
20
21
22
23
24
25
26
27
28
29
30
31
32
33
34
35
36
37
38
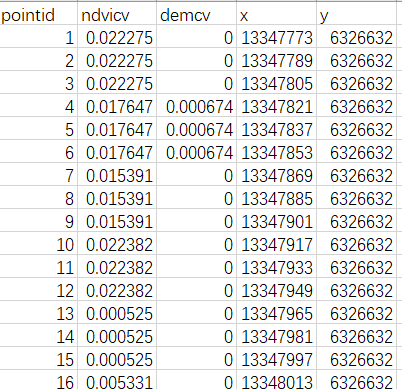
| import pandas as pd
from tqdm import tqdm
from itertools import combinations
file_path = 'C:/Users/QBrer/OneDrive/桌面/新建 Microsoft Excel 工作表.xlsx'
df = pd.read_excel(file_path)
distances = []
total_combinations = len(list(combinations(df.index, 2)))
with tqdm(total=total_combinations) as pbar:
for i, j in combinations(df.index, 2):
dx = abs(df.loc[i, 'x'] - df.loc[j, 'x'])
dy = abs(df.loc[i, 'y'] - df.loc[j, 'y'])
if (dx == 16 and dy == 0) or (dy == 16 and dx == 0):
distances.append((i, j))
pbar.update(1)
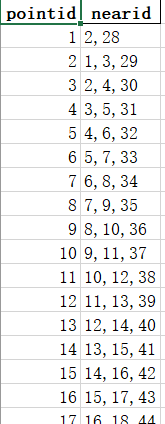
adj_list = {}
for i in df.index:
adj_list[df.loc[i, 'pointid']] = []
for i, j in distances:
adj_list[df.loc[i, 'pointid']].append(df.loc[j, 'pointid'])
adj_list[df.loc[j, 'pointid']].append(df.loc[i, 'pointid'])
data = []
for point, neighbors in adj_list.items():
data.append([point, ','.join(map(str, neighbors))])
df_adj = pd.DataFrame(data, columns=['pointid', 'nearid'])
output_file_path = 'C:/Users/QBrer/OneDrive/桌面/邻接表加减.xlsx'
df_adj.to_excel(output_file_path, index=False)
print(f"数据已保存到 {output_file_path}")
|
